


By Dan Noel, CEO, The Johnson Team. Data through October 31, 2026.
If you are buying in the Colorado Springs housing market (El Paso and Teller counties) right now, you can take your time and be selective. If you are selling, you have to price aggressively from the start if you want a quick sale. That is what our agents are seeing with their own clients, and the October numbers point the same way: more months of inventory, fewer sales than a year ago and homes selling a bit further below their original price.
Unless we say otherwise, the figures here cover all residential homes in El Paso and Teller counties, and the source of each is listed at the end.
What the numbers show
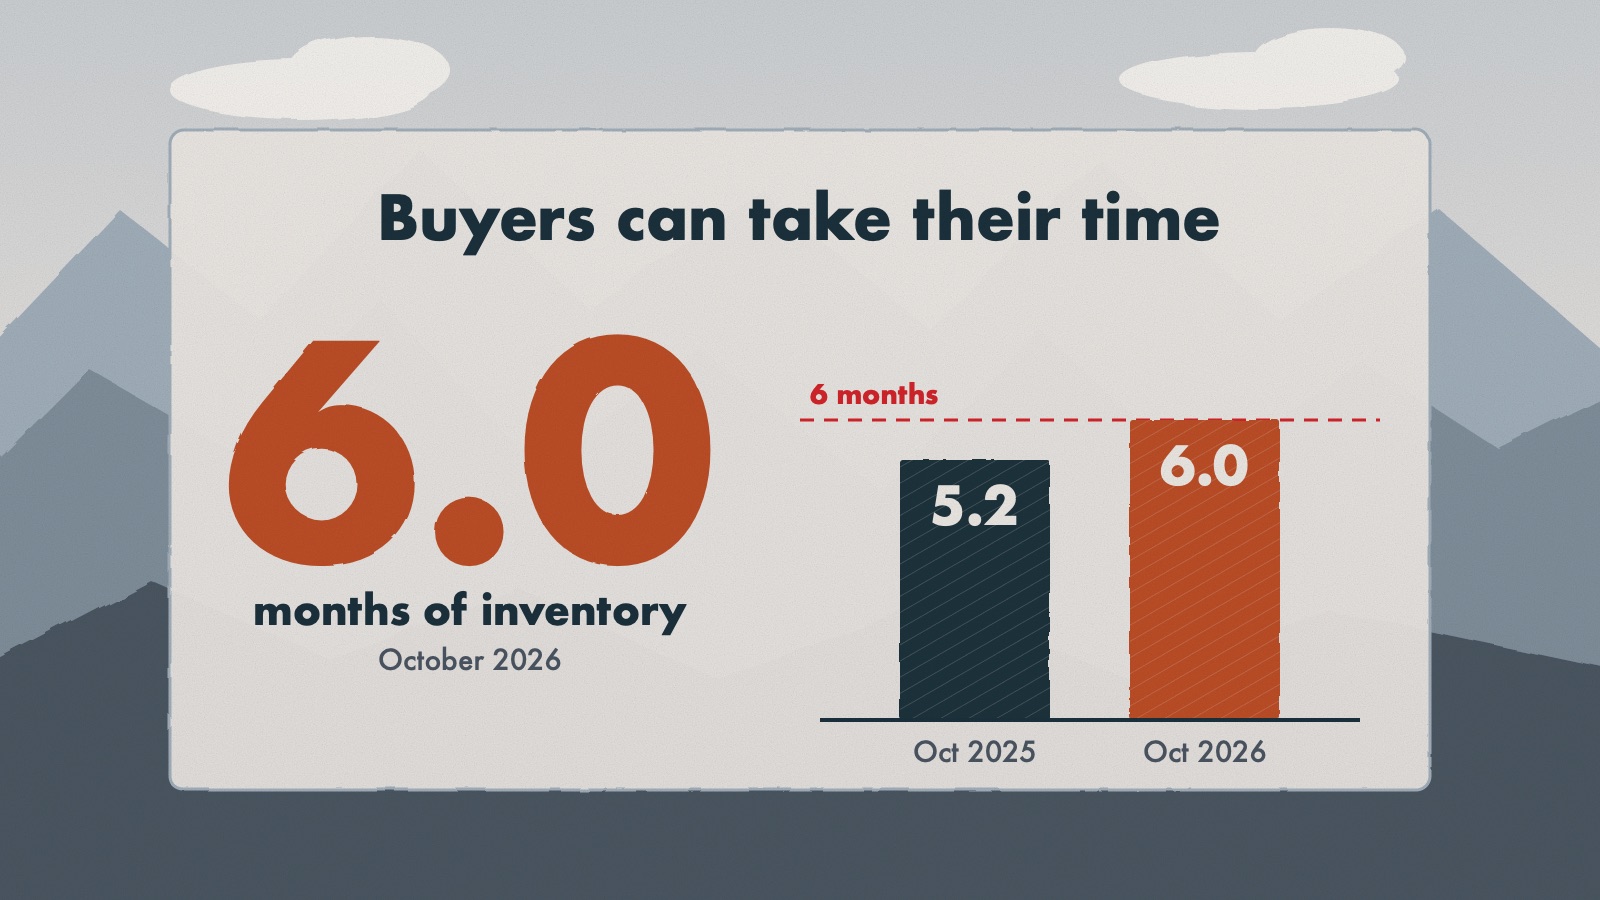
The measure to watch is months of inventory, which is how long the homes now for sale would last at the current pace of sales. For all residential homes it was 6.0 in October, up from 5.5 in September and 5.2 in October 2025. Six months is a common rule of thumb for a market tipping toward buyers. It is a rough line, not a fact. For October in earlier years, the same measure was 1.0 in 2021, 2.9 in 2022, 3.7 in 2023, 4.1 in 2024 and 5.2 in 2025. October 2026 is the highest of those six. For more on supply, see our earlier post Housing Shortage vs. Rising Inventory in Colorado Springs.
All residential homes in El Paso and Teller counties, October 2026, against September 2026 and October 2025:
| Oct 2026 | Sep 2026 | Oct 2025 | |
|---|---|---|---|
| Homes for sale at month end | 4,724 | 4,943 | 4,675 |
| New listings | 1,172 | 1,252 | 1,359 |
| Homes sold | 781 | 881 | 888 |
| Median sold price | $450,000 | $459,900 | $455,000 |
| Average days on market | 58 | 51 | 56 |
| Sale price against original price | 96.4% | 97.2% | 96.8% |
Fewer homes came on the market than in either comparison month, but fewer also sold. Homes that sold took 58 days on average, against 51 in September, and they closed a little further below their original price. The median sold price, for all residential homes, was lower than in both comparison months.
Our November newsletter reported 772 sales, and late-reported sales since then bring October to 781.
Single-family homes against attached homes
Single-family homes make up most of the sales, so they set the totals for the two counties. Their months of inventory was 5.9 in October, against 5.4 in September and 5.1 a year ago, and new single-family listings were 994, against 1,084 and 1,169.
Condos, townhomes and patio homes together are slower. Their months of inventory was 7.0 in October, against 6.4 in September and 6.0 a year ago. New listings in that group were 178, against 168 in September and 190 in October 2025. We will cover attached homes in a fuller article soon. For now, the short version is that a buyer of an attached home has even more room to be selective than a buyer of a single-family home.
What it means if you own or want a home here
Buying. With months of inventory at 6.0, the highest for an October in six years, you have more room to compare and wait, and agents in one of our groups described their buyers as slow and non-committal. Homes that sold in October closed at 96.4% of their original price, so ask what a seller would do on price or costs, and compare the homes near the one you like before you write an offer.
Selling. If you want a quick sale, our agents say the price has to be aggressive from the start. One agent told us a buyer backed off a house they liked after a nearly identical home listed for much less, so a seller is competing with the cheaper listing too. In the October MLS data, homes that sold took 58 days on average, up from 51 in September, and closed at 96.4% of the original price, down from 97.2%.
Mortgage rates
Freddie Mac’s weekly survey put the average 30-year fixed rate at 7.33% for October, and at 7.11% on November 12. That is a national benchmark, not the rate any one borrower would be quoted. We wrote about what was driving rates at the start of October in Colorado Springs Mortgage Rates Hit 7.28%: What’s Driving Them and What It Means for You.
Source and method
Source: Elevate MLS, data through October 31, 2026, for residential properties in El Paso and Teller counties. New listings, months of inventory, homes for sale at month end and sale price against original price come from the team’s saved Elevate MLS statistics searches. Homes sold, median sold price and average days on market come from Elevate MLS records pulled through the Repliers data service on November 14, 2026. Mortgage rates are from the Freddie Mac Primary Mortgage Market Survey. Days on market is an average, not a median. Reported sales were not necessarily listed or sold by The Johnson Team and are intended to show market trends.
Rates and loan terms vary by lender, borrower and property. Examples are illustrative and are not an offer of credit.

Want To Learn More?
Let’s get started with a one-on-one conversation about your goals.